Output
This section serves as a reference for users who have run a simulation, and wish to analyze the data this simulation has outputted. This page goes over every aspect of the files found in the output directory.
To recap: in-degree means number (or list) of followers, or subscribers to our agent, out-degree is the number (or list) of agents whom our agent is following, and culmulative-degree includes those whom our agent follows and our agent's followers.
Agent Type Info
agenttype_info.dat
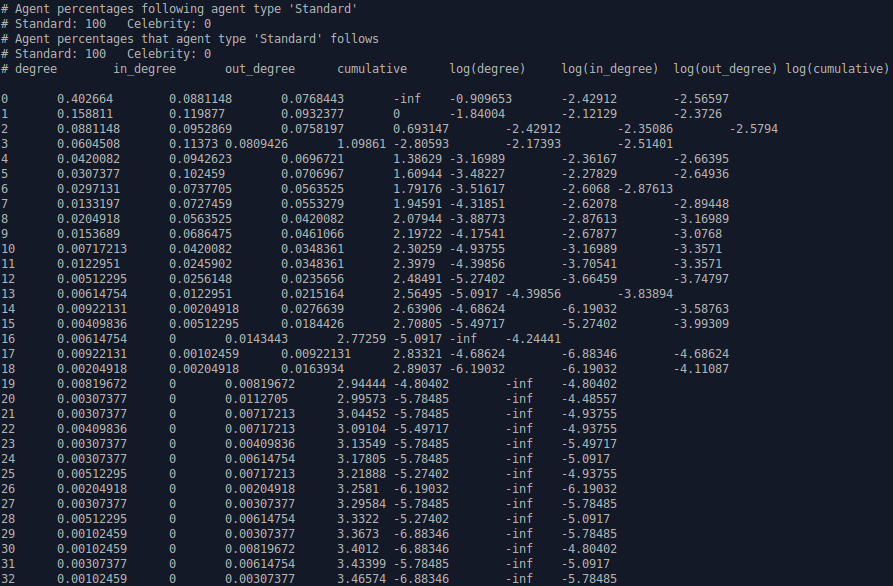
Present and named for every single agent_type in the network (e.g. a 'Standard' agent_type would have a file named Standard_info.dat).
This file outlines the proportion of each agent_type that follow this particular agent_type, the proportion of each agent_type that this particular agent_type is following, and all the possible degrees for agents of this agent type with the normalized probability of having an in-degree, out-degree, and cumulative-degree of this value, with the logs of each. An example of the information stored in this file is shown below:
Average (Mode) Tweet Info
Average_tweet_info.dat
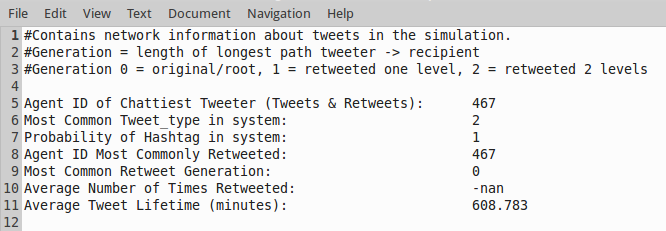
This file provides information relating to the chattiest tweeter and the agent most commonly retweeted
An example of the information stored in this file is shown below:
Categories Distribution
Categories_Distro.dat
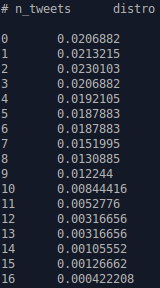
Outlines the number of tweets, follows, and retweets that have occurred in a network simulation in their respective bin thresholds.

Cumulative-Degree Distribution
cumulative-degree_distribution_month_000.dat
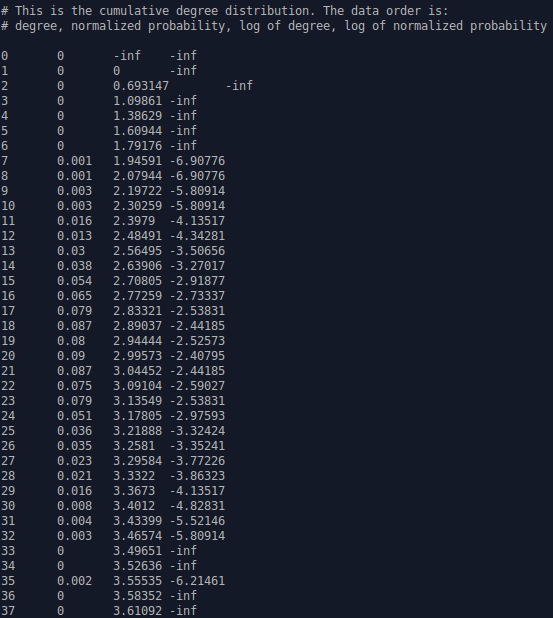
Outlines all the possible cumulative-degrees an agent can have in that particular month in the simulation, as well as the corresponding normalized probability, logarithm, and normalized probability logarithm of that cumulative-degree. The following shows some of the information stored in this output file:
Degree Distribution by Follow Model
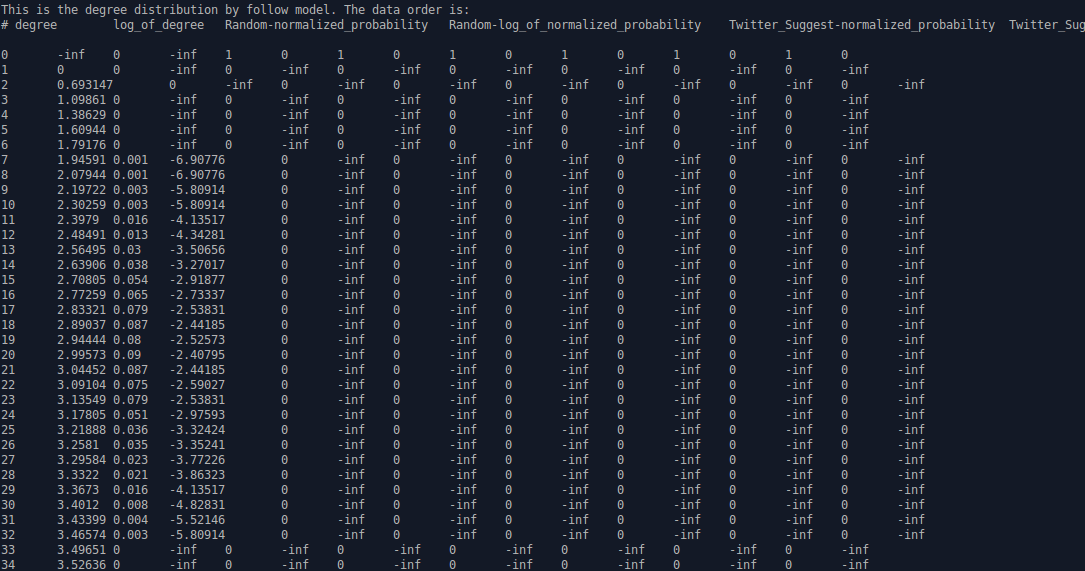
dd_by_follow_model.dat
Indicates the normalized probability and the normalized probability logarithm that an agent of a particular cumulative-degree made its connections via each particular follow method.
In-Degree Distribution
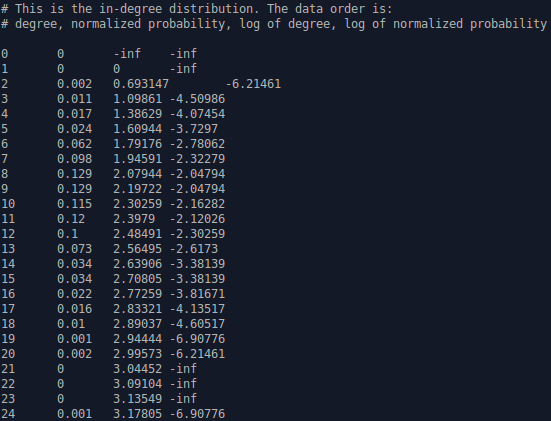
in-degree_distribution_month_000.dat
Outlines all the possible in-degrees an agent can have in that particular month in the simulation, as well as the corresponding normalized probability, logarithm, and normalized probability logarithm of that in-degree. An example of this file's contents is shown below:
Main Statistics
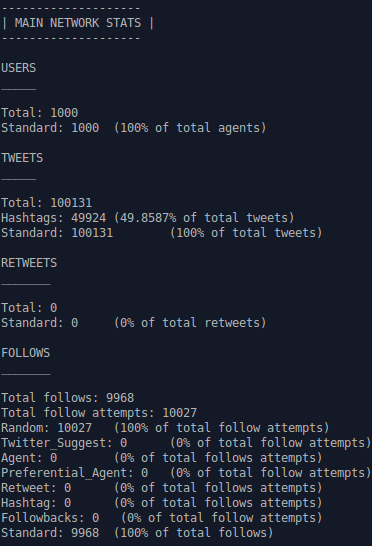
main_stats.dat
Outlines the most important network statistics for this simulation. Under USERS we have the total number of agents by the simulation's end, and the number and proportion of those agents of each particular agent type. Under TWEETS we have the total number of tweets made during the simulation, as well as the number and proportion of those that contain a hashtag and the number and proportion of those that were tweeted by agents of each agent type. Under RETWEETS we have the total number of retweets that occurred throughout the course of the simulation, and how many of those retweets were done by agents of each agent type. Under FOLLOWS we have the total number of follows and the total number of follow attempts that occurred in the simulation, the number and proportion of follow attempts achieved through each follow method, and the number and proportion of follows made by agents of each agent type. The follow attempts are usually greater in number than the number of actual follows, since though an agent may attempt to follow another agent, they may be unable to due to a language barrier, differences in ideology, etc.
Most Popular Tweet Content
most_popular_tweet_content.dat
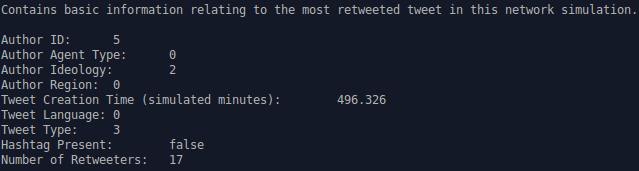
Details basic information regarding the most retweeted (most popular) tweet in the network simulation.
Basic information includes: the ID number of the tweet author, the author agent_type, the author's ideology, the region the author lives in, the simulated point in time in the simulation when the tweet was created, the language of the tweet, the tweet type, whether or not a hashtag is present in the tweet, and the number of retweeters for this tweet.
For the variables 'Author Agent_Type', 'Author Ideology', 'Author Region', 'Tweet Language', and 'Tweet Type', a number will be printed instead of a name. For example, for 'Author Ideology', if you have 3 possible ideologies in your network, 'Red', 'Green', and 'Blue', and the author of this tweet is ideologically 'Red', the number '0' will be printed beside 'Author Ideology' instead of 'Red', since 'Red' is the zeroth element in the list (array) of ideologies.
An example of the data found in this output file is shown below:
Network Connections
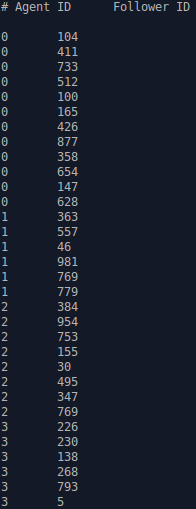
network.dat
Outlines which agents (by ID number) are following which other agents. In this file there are two columns, the first column are agents, the second column their followers.
Network Visualization
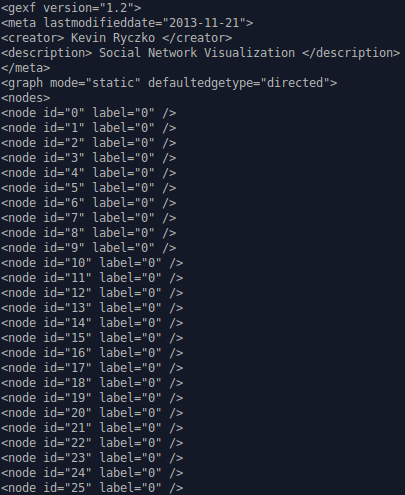
network.gexf
.gexf are files created to be run in third party software Gephi.
network.gexf is a file that can be used to create a visualization of the connections between agents in your network in Gephi. The following shows the contents of this file:
Out-Degree Distribution
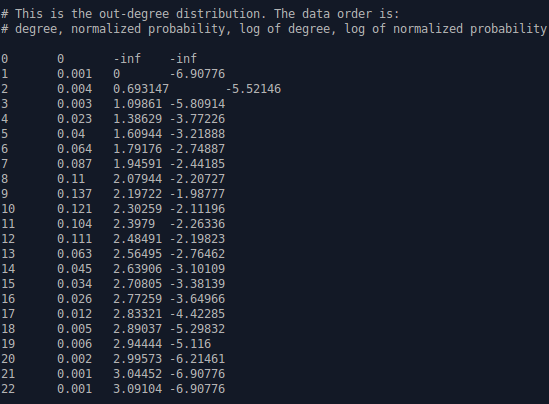
out-degree_distribution_month_000.dat
Outlines all the possible out-degrees (follows) an agent can have in that particular month in the simulation, as well as the corresponding normalized probability, logarithm, and normalized probability logarithm for that out-degree. Below is an example of the contents of this file:
Region Connection Matrix
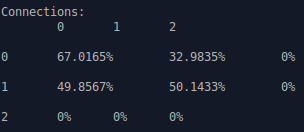
region_connection_matrix_month_000.dat
Displays the connections made between regions for a particular month in the simulation. The regions in this file are labelled by number according to their order of configuration in 'INFILE.yaml'. If 'Ontario' is the first region in the input file, than it will be labelled as '0' since it is the zeroth element in the list of regions.
In the example below, for this month in the simulation, the 'zeroth' region had 67.0165% of its follow from agents in the 'zeroth' region, 32.9835% of its follows from agents in the 'first' region, and 0% of its follows from agents in the 'second' region.
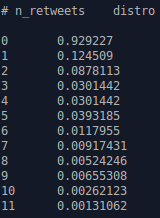
Retweet Distribution
retweets_distro.dat
Outlines the distribution of how many agents have made every possible number of retweets within the network simulation.
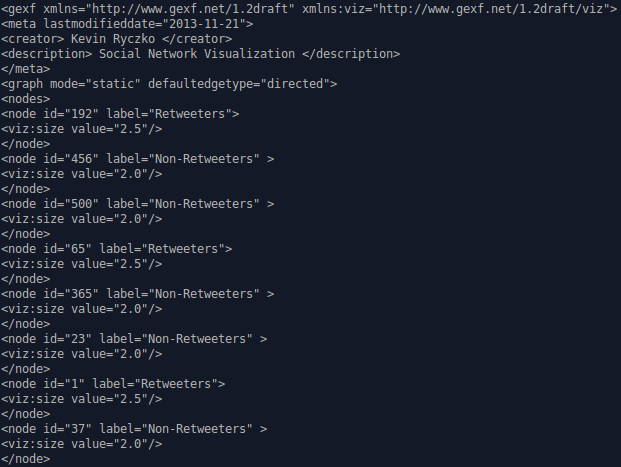
Retweet Visualization
retweet_viz.gexf
retweet_viz.gexf is a file that can be used to vizualize how tweets were retweeted in the network simulation using visualization software such as Gephi. An example of this file can be seen below:
Tweet Distribution
tweets_distro.dat
Outlines the distribution of how many agents have made every possible number of tweets within the network simulation.